Aleksey Novikov
Mar 1, 2021
Analyze and process data tables by tools of Abris and not only.
If you want not only to view data in tables but make some analysis or external processing you can use the advantages of Abris Platform and additional tools.
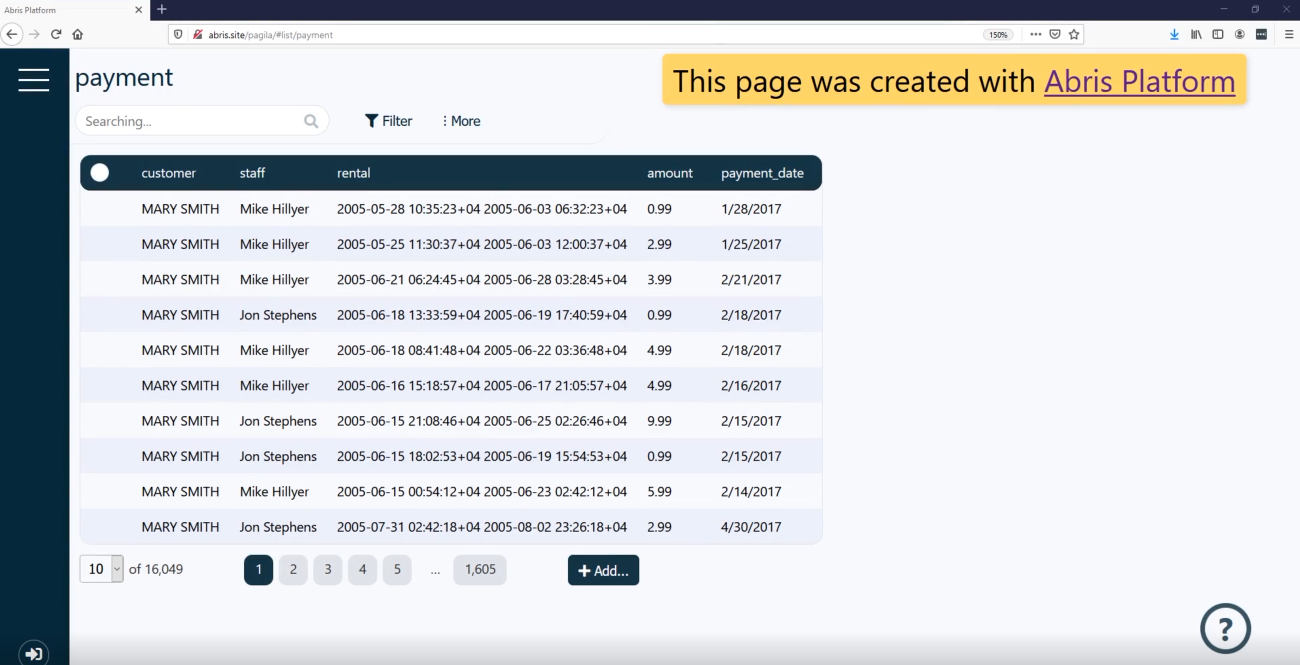
Let’s look at the table with more than sixteen thousand records.
First we can calculate summaries for numeric fields.
Click More and Summary.
The summaries row will appear at the table footer.
Then, for column amount we can select:
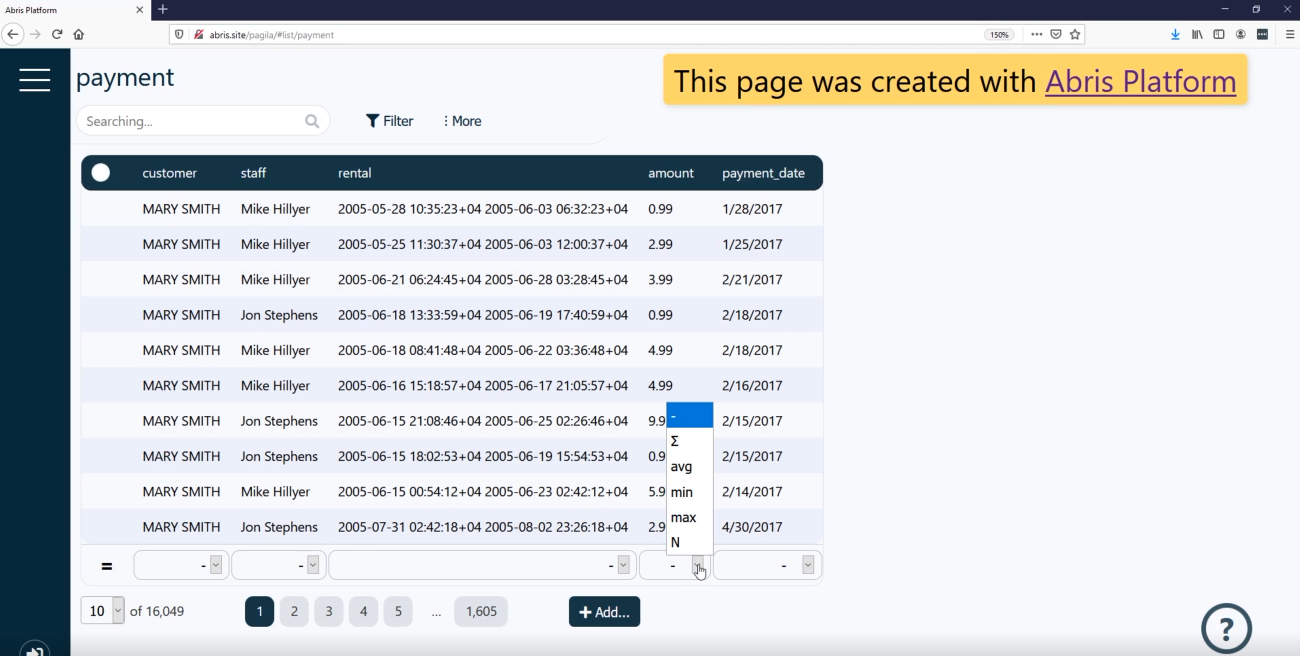
Different operations are available for different data types. For example, for dates you can use only maximum and minimum.
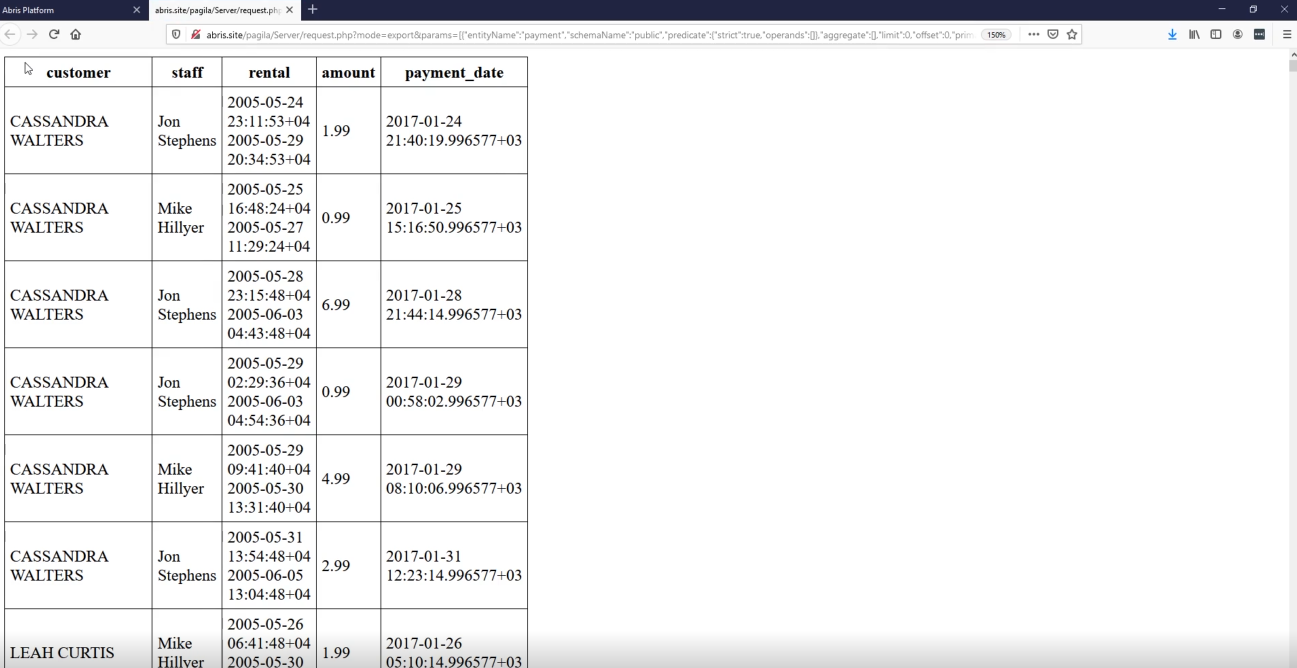
If you want to print your data and analyse it manually, the easiest way is to export to HTML and print, or copy and paste to your text editor like Microsoft Word or LibreOffice Writer.
If you need more powerful analysis with Microsoft Excel or LibreOffice Calc, you can export data as XLSX.
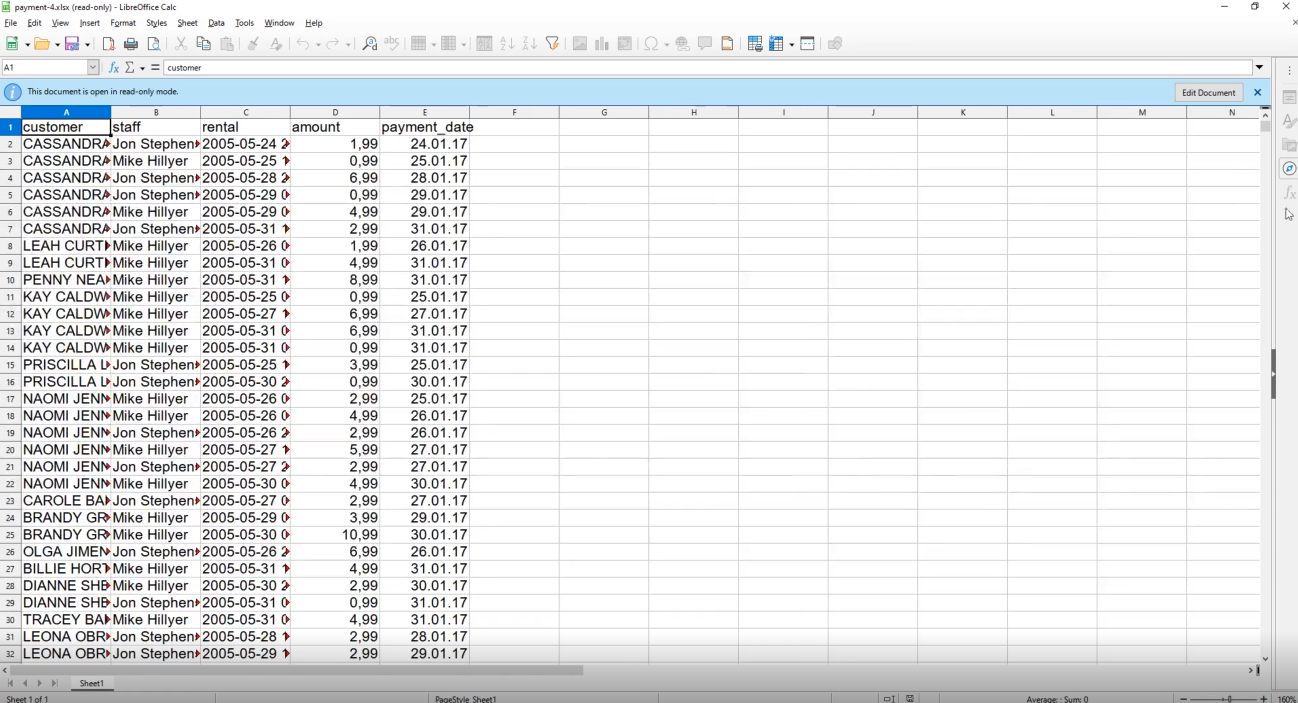
Be sure that ALL table rows will be exported. We use very efficient algorithm for file creation. So you don’t need to wait minutes for your file download to start.
Notice that all those features are available for any table in your application. You don’t need to configure this behavior for every table. It can’t be used in Abris Platform out of the box.
For more information, see the video-instruction:
No code, no special design. Just install and use.
© 2020 Research laboratory ABRIS Ltd