Alexey Novikov
Jun 14, 2020
How to make PostgreSQL data pagination faster using recordset row count estimation.
When we want to display data from a large table in the user interface, we usually get it using the query
SELECT * FROM <table_name> WHERE <condition> ORDER BY <key> LIMIT <limit> OFFSET <offset>
If sorting is performed on an indexed field, then the query is executed fast. But is this enough for the user interface to work effectively?
Let’s look at the standard data view.
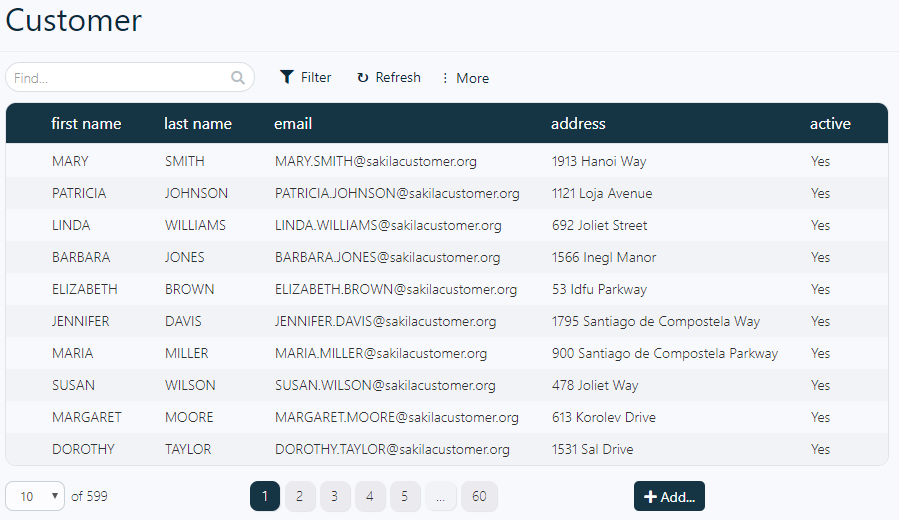
Screenshot from https://abris.site/pagila/#list/customer
Here we see the result of the query, buttons for switching pages and a field indicating the total number of rows.
This little field brings a big problem. It represents pretty important information for the user because the user wants to know how lot of data is available to him. But in order to get the total number of rows, you must run the following query.
SELECT count (*) FROM <table_name> WHERE <condition>
So, to display data in a pagination form, you need to execute two queries. This means that the server will access the table twice. Let’s check how much time it takes to complete these queries. Of course, for small tables and simple queries, this time is not very long. Therefore, we’ll come up with some abstract example, realizing that tables of a comparable size and queries of corresponding complexity may well appear in real applications.
Create two tables. The first (parent) table will contain 10K rows (thanks to Joe Nelson for idea to create a lot of random data).
CREATE TABLE parent AS
  SELECT
    generate_series(0,1000) AS i,
    substr(concat(md5(random()::text), md5(random()::text)), 1, (random() * 64)::integer + 1) AS s;
ALTER TABLE parent ADD PRIMARY KEY (i);
The second (child) table is 10M rows referred to one of the rows of the parent table using the primary key.
CREATE TABLE child AS
  SELECT
    generate_series(0,10000000) AS i,
    substr(concat(md5(random()::text), md5(random()::text)), 1, (random() * 64)::integer + 1) AS s;
ALTER TABLE child ADD PRIMARY KEY (i);
ALTER TABLE child ADD COLUMN parent_i integer REFERENCES parent (i);
update child set parent_i = i % 1000;
CREATE INDEX parent_index ON child(parent_i);
After creating tables we need to notify query planner of drastically changed table size.
VACUUM ANALYZE;
To display the table data in the interface, you must execute the query (we don’t show actually returned rows, it is not important for now):
select * from child left join parent on child.parent_i = parent.i order by child.i limit 10;
…
Execution time: 0.278 ms
and also count the number of rows as a result of this query:
select count (*) from child left join parent on child.parent_i = parent.i;count
--------
10000001
Execution time: 494.535 ms
While the first query is performed less than a millisecond on the server that we used for tests, the second is already performed in 500 ms. And it’s a little annoying. Information that is very important to us (row data) is loaded thousands of times faster than information that is necessary only for orientation (number of rows).
We found this problem when we used our Abris Platform with a large amount of data. To fix it was necessary in order to make the user interface more responsive and faster.
We should very clearly understand that when there are a lot of rows in the table, the exact number of them is not important for the user. Only an approximate number matters. The user must understand how many rows are in the table, but he does not need an absolutely exact amount.
Let’s try to estimate the number of rows in some other way. If you look at the query, it is easy to see that the number of rows in the result is equal to the number of rows in the child table. Fortunately, PostgreSQL stores sample information about the size of tables and is easy to obtain.
SELECT reltuples :: bigint AS estimate FROM pg_class WHERE oid = ‘child’ :: regclass;estimate
--------
10009754
Execution time: 0.033 ms
This is an effective way, but it is not quite suitable for Abris Platform, which has search and filtering, and displaying views. Most of the queries sent to the server contain WHERE. For example, consider this query:
select * from child left join parent on child.parent_i = parent.i where child.s like ‘b%’ order by child.i
First of all let’s get the number of rows in this query with the count function.
select count (*) from child left join parent on child.parent_i = parent.i where child.s like ‘b%’;count
---------
624294
Execution time: 377.466 ms
Exactly, but for a long time. Let’s see what the planner says.
explain select * from child left join parent on child.parent_i = parent.i where child.s like ‘b%’;QUERY PLAN
------------
Gather (cost = 1031.52..289768.97 **rows = 603811** width = 80)...
...
Planner gave the estimate, it is of course not accurate, but it can be used in the interface as an approximate value.
Lower number of rows gives the lower estimation accuracy. For queries that return a small number of rows, it would be better use the count function. But this can not always be done. Consider two queries, each of them returns a small number of rows.
The first one is:
select * from child left join parent on child.parent_i = parent.i where child.s like ‘abcde%’;
In our test database this query returns with 13 rows. The count function on this request takes more than 300 ms.
The second query is simpler and uses much less data:
select * from parent where s like ‘a%’;
It returns 60 rows, but the count function on this request is executed almost instantly — less than one millisecond.
How do we know when we should use count, and when we should be satisfied with the approximate value? The planner will help us again. Let’s start with a simpler query.
explain select * from parent where s like ‘a%’;
QUERY PLAN
-----------------------------
Seq Scan on parent (**cost = 0.00..21.51** rows = 61 width = 39)...
The planner returned an estimated number of rows. Besides it said that this query has a very low cost — only 21.51 points. This gives us a reason to understand that the number of rows in the query can be retrieved using count function.
explain select * from child left join parent on child.parent_i = parent.i where child.s like ‘abcde%’
QUERY PLAN
-----------------------------
Nested Loop Left Join  (**cost=1000.27..229135.67** rows=985 width=80)...
Here the accuracy of estimating the number of rows is very low. However, the cost of the request is 10,000 times higher. Perhaps in this case it is better not to overload the server with a count function.
This algorithm is easily implemented in programming language if you use EXPLAIN in JSON format. We implemented it in our free REST server, the source code of which is available on GitHub.
No code, no special design. Just install and use.
© 2020 Research laboratory ABRIS Ltd